
Packet Capture on a Remote Cisco Device
Typically when I need to do a packet capture on a remote Cisco IOS/IOS-XE device, I use RSPAN to mirror that traffic someplace where a VM can receive the capture. This week I learned a trick that allows much more flexibility!
ERSPAN is like RSPAN in that you can send mirrored traffic to other devices, but that “E” (which stands for encapsulated) makes a world of difference! ERSPAN encapsulates SPAN into GRE. GRE (generic routing encapsulation) is a common way to tunnel traffic across networks. It’s often paired up with IPSEC and used in VPN scenarios. Tunnel interfaces by default use GRE and simply require a source and destination address to start encapsulation.
Any destination IP address can be used with ERSPAN, so what happens if the destination address is where Wireshark is running on a computer? Wireshark sees the live capture! The packets are encapsulated in GRE, but Wireshark displays the information of the encapsulated traffic, so it’s not a problem. Here’s how it’s done:
How to Setup the ERSPAN
On the device where you want to run the capture enter global config mode and enter the following:
monitor session 1 type erspan-source
source interface Te1/0/1
destination
erspan-id 5
ip address 10.1.1.10
origin ip address 10.1.1.1
The session number is simply the monitor session and can be any available session.
type erspan-source signifies that this will be an encapsulated SPAN session.
source can either be an interface or VLAN from which you want to pull the capture.
erspan-id is the ID of the GRE tunnel and can be anything between 1-64.
ip address is the IP of the workstation where Wireshark is running.
origin ip address is the interface on the Cisco device where the tunnel will be sourced.
How to Prepare Wireshark
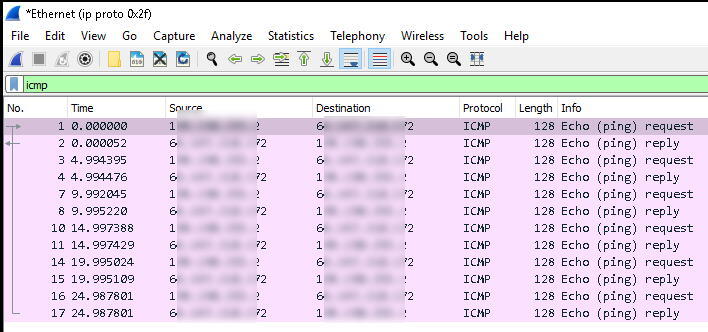
On the workstation start Wireshark, but don’t start the capture just yet! First create a capture filter and let’s only capture GRE packets so that we’re only seeing the ERSPAN traffic in Wireshark. To do this enter ip proto 0x2f (GRE is protocol 47 which is 2F in HEX) and then start the capture.
Start the ERSPAN Session
On the Cisco device enter the monitor session 1 type erspan-source config mode and run no shutdown. By default the session is setup in a shutdown state. You should now see Wireshark receiving the capture!
Troubleshooting ERSPAN to Wireshark
If you don’t see packets in Wireshark then run show monitor session 1 to see the details of the RSPAN. If all looks correct there, what can we do?
Problem 1
I found that the ERSPAN would not work reliably if it was being transported over the same interface the capture was running on. The fix was to apply an ACL filter and then traffic started showing up. The documentation indicates that it should work:
ERSPAN source sessions do not copy ERSPAN GRE-encapsulated traffic from source ports. Each ERSPAN source session can have either ports or VLANs as sources, but not both.” Source Cisco
This statement indicates that the RSPAN traffic wouldn’t be cloned (thus creating an infinite loop of traffic), but I couldn’t get it to work without the filter. Here is an example where I filter down traffic to 8.8.8.8.
ip access-list extended PCAP
permit ip host 8.8.8.8 any
permit ip any host 8.8.8.8monitor session 1 type erspan-source
source interface Te1/0/3
filter ip access-group PCAP
destination
erspan-id 5
ip address 10.1.1.10
origin ip address 10.1.1.1
Problem 2
In some cases I found that capturing an interface would not work reliably, but capturing the VLAN would. This might be related to Problem 1, but haven’t confirmed. Try changing the source interface to source vlan and use the VLAN you want to capture.
I’ll post more solutions as I encounter them. This is my new favorite tool!